Here, I showcase selected projects that highlight my expertise in data analysis, operational efficiency, and public health research. Each project demonstrates my commitment to data-driven decision-making and my ability to lead impactful initiatives. From optimizing document processing workflows to advancing the digitization of vital records, these projects reflect my proficiency in R, data science methodologies, and project management.
Operational Process Improvement
Overview
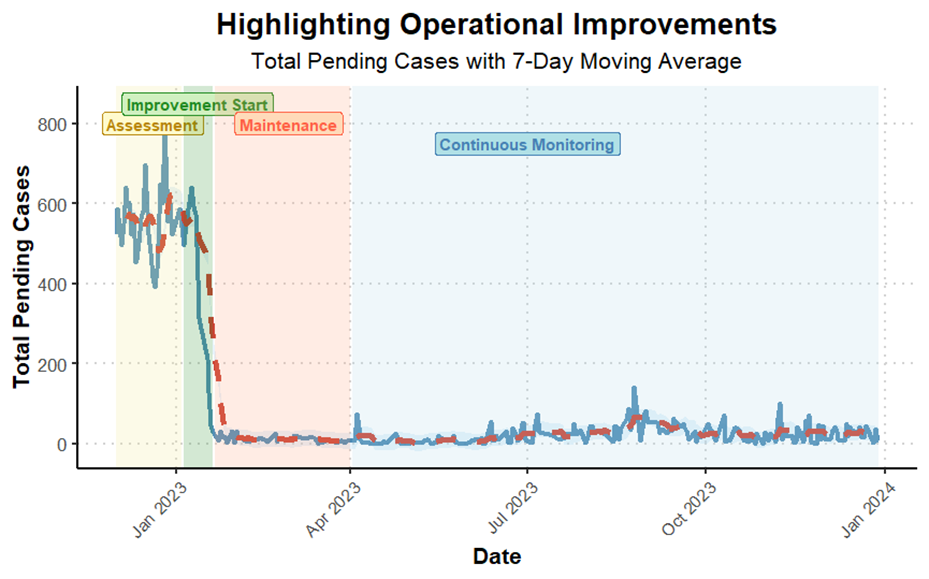
Led an initiative to optimize the processing of vital birth documents, achieving significant reductions in turnaround times.
Methodologies & Tools
Data Analysis and Visualization
- Employed
dplyrfor data wrangling, filtering, and aggregating metrics from productivity records. - Used
ggplot2to visualize daily and weekly trends in document processing, highlighting bottlenecks and improvement areas.
Time-Series Forecasting
- Utilized the
forecastandtsibblepackages in R to develop a predictive model for daily processing needs based on historical intake and productivity data. - Implemented exponential smoothing techniques to provide accurate short-term forecasts, enabling proactive resource planning.
Performance Monitoring
- Applied the
lubridatepackage for time-based data manipulation, allowing for granular analysis of daily processing patterns and seasonal effects. - Created a dashboard with
shinyto visualize processing metrics and forecasts, enabling stakeholders to make informed adjustments.
Impact
Reduced processing turnaround times by over 80%, and increased productivity by over 20% through data-driven insights and model-informed resource allocation.
Data Modernization and Records Management
Overview
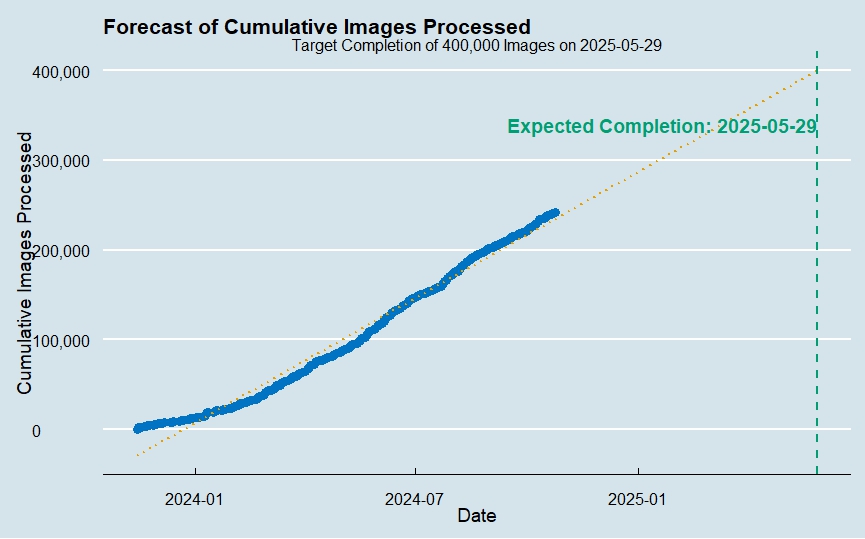
Managed the Local Government Records Management Improvement Fund (LGRMIF) project to digitize sealed vital records, using data projections to meet milestones and ensure compliance.
Methodologies & Tools
Predictive Modeling
- Built a daily productivity projection model using
prophetandforecastpackages, allowing for accurate estimation of completion timelines and resource requirements. - Utilized regression analysis to assess the impact of variable factors on project milestones.
Grant Tracking and Reporting
- Integrated
rmarkdownandknitrto generate automated progress reports, including data visualizations and performance summaries, for grant compliance and updates. - Developed visualizations in
ggplot2to track cumulative records digitized, showcasing progress to internal and external stakeholders.
Milestone Optimization
- Used
tidyverseandlubridateto create time-based projections and adjust workflows based on productivity data, ensuring alignment with quarterly goals.
Impact
Digitized over 600,000 sealed documents, achieving compliance with grant requirements and contributing to long-term data preservation.
Staff Awareness Survey
Overview
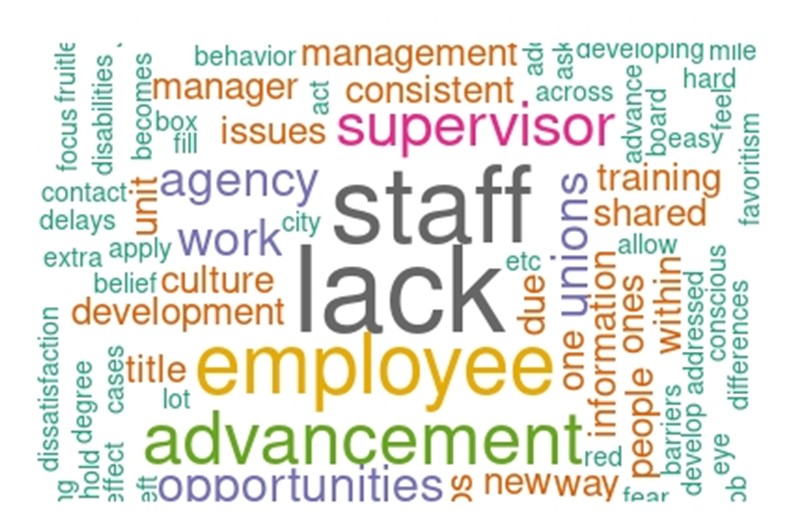
Conducted a comprehensive analysis of staff survey responses to evaluate professional development perceptions and identify barriers to promotions and salary increases.
Methodologies & Tools
Survey Analysis and Data Cleaning
- Utilized
tidyverseandjanitorto clean and organize survey response data, ensuring consistency across demographic and categorical variables. - Applied data transformation techniques to aggregate responses, creating subsets for targeted analysis (e.g., by bureau and demographics).
Statistical Testing
- Used
psychandsurveypackages to conduct exploratory data analysis (EDA), identifying major trends and statistical relationships between demographics and survey responses. - Conducted t-tests and ANOVA to compare responses across different staff groups, assessing significant differences in perspectives on salary and promotion.
Text Mining
- Used
tmto text mine open-ended responses to questions, quantifying attitudes toward professional development and barriers to advancement. - Created visual representations of sentiment trends using
ggplot2to communicate findings effectively.
Impact
Identified areas for targeted development programs, providing leadership with actionable insights for enhancing staff engagement and career growth.
Document Volume Analysis and Trends
Overview
Analyzed the distribution of various output types over time to highlight trends in document processing, with spikes and fluctuations that may correlate with specific events. The aim is to provide insight into the volume and type distribution to inform strategic decisions, and operational maintenance and improvement.
Methodologies & Tools
Trend Analysis
- Examined overall trends to identify peak periods, anomalies, and periodic fluctuations in document processing.
- Used statistical techniques to analyze whether observed peaks align with significant external events (i.e., policy changes, public health updates) impacting document processing.
- Employed R’s
dplyrpackage for data manipulation, filtering, and summarization to streamline dataset into a format suitable for visualization and trend analysis.
Visualization and Layered Plotting
- Utilized the
ggplot2library in R to create layered area plots that clearly differentiate document types by color, providing a visual hierarchy. - Applied color-coding techniques to represent each document type distinctly, enhancing readability and interpretability for stakeholders.
Impact
Helped identify peak periods for specific document types, enabling better resource allocation and planning. This was used to provide leadership with clear visual insights, supporting strategic decisions for document management processes, and informed evaluations on document volume to improve service delivery.

